
Here is something almost nobody has told you: car insurance prices are falling. The Bureau of Labor Statistics index for motor vehicle insurance was down 5.1% in the twelve months to August 2026, after rising a cumulative 57% between December 2021 and December 2025. If you have not shopped since 2024, you are probably paying a 2024 price in a 2026 market, and that is the single largest saving available to most people.
Everything else on the list of how to lower car insurance is real but smaller. This piece ranks them by what the evidence says they are actually worth, and is honest about where the evidence runs out.
Key takeaways
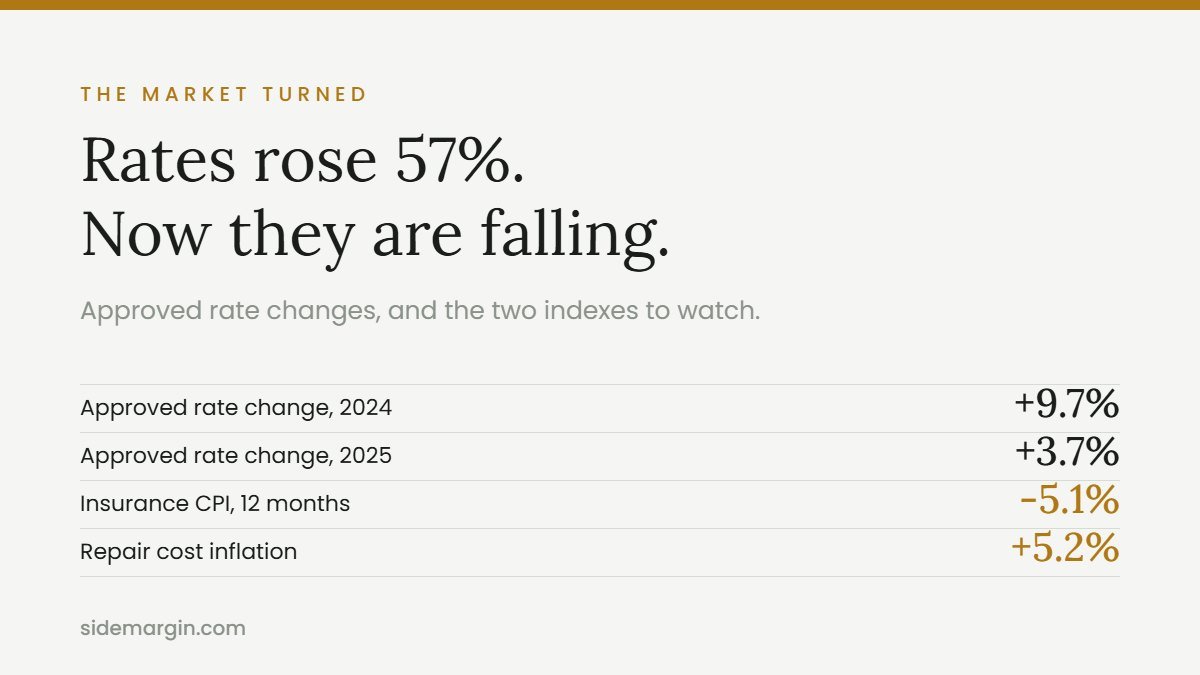
- The market turned. Rates rose 57% over four years and are now falling. Approved rate changes went from +9.7% in 2024 to +3.7% in 2025, and the CPI index is negative in 2026.
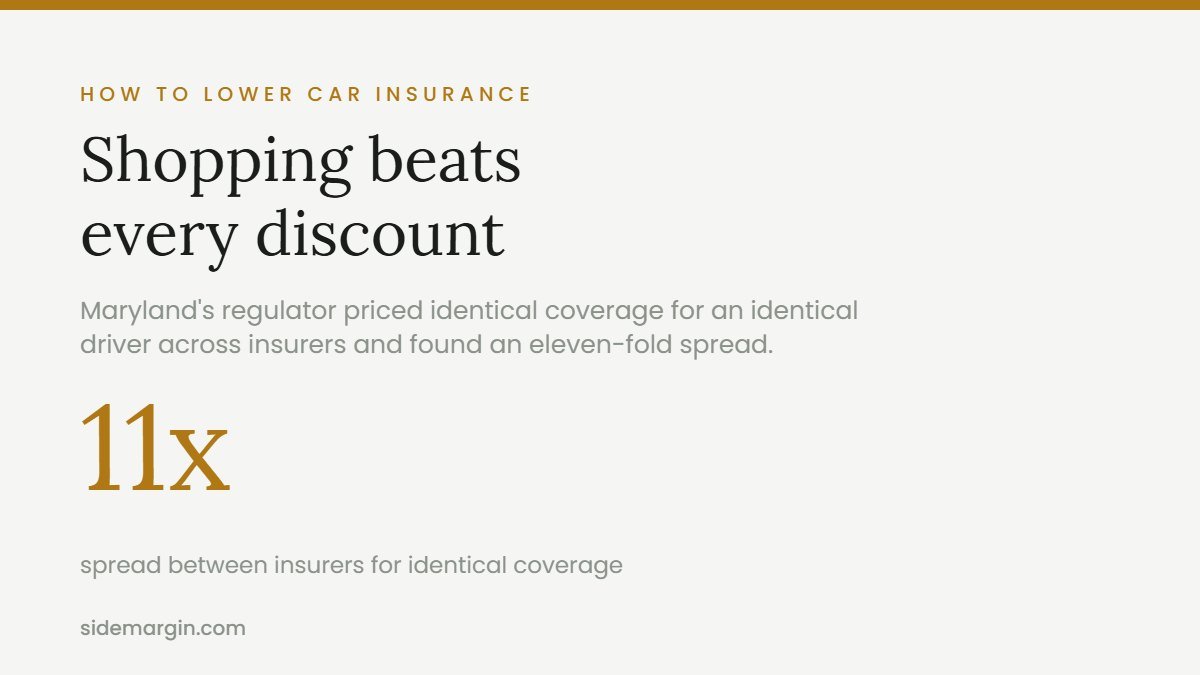
- Shopping is worth more than every discount combined. Maryland’s own regulator priced identical coverage for an identical driver across insurers and found an eleven-fold spread.
- Quoting does not hurt your credit. Insurance credit checks are soft inquiries.
- The state minimum is now below the average injury claim. Average bodily injury severity was $28,278 in 2024, and 2025 data puts the average payout above $30,000. A 30/60 minimum does not cover the average.
- Raising your deductible is almost always expected-value positive. The arithmetic is in this piece.
- Telematics can raise your premium, not just lower it, and which is true depends on the programme. Ask before enrolling.
- Repair inflation is still running at 5.2% while the insurance index is at -5.1%. That gap is what to watch.
What rates have actually done
| Twelve months to | Change in the motor vehicle insurance CPI |
|---|---|
| December 2021 | +4.1% |
| December 2022 | +14.2% |
| December 2023 | +20.3% |
| December 2024 | +11.3% |
| December 2025 | +2.8% |
| August 2026 | -5.1% |
Chaining those December figures gives a cumulative increase of about 57% from December 2021 to December 2025. That is my own arithmetic on the published index, and it explains why this bill feels different from every other bill.
The turn is corroborated on the regulatory side. AM Best reports approved private passenger auto rate changes of +9.7% in 2024 and +3.7% in 2025. Triple-I puts the 2025 personal auto combined ratio at 94.4 with premium growth of 3.6%, “the lowest level since 2020”, and describes personal auto as “a standout performer”. Insurers are making money again, which is the condition under which rates come down.
Florida is the clearest case. The state’s top five auto groups, covering 78% of the market, indicated an average 8% decrease for 2026, one of them 16.5%. State Farm filed a 10% decrease there, and Florida’s personal auto liability loss ratio hit 52.5% in 2025, the lowest in fifteen years. In California, State Farm filed a 6.2% auto rate decrease in November 2025.
One caution. A national index is not your renewal notice. Some states are still rising while the national number falls, and your own rate depends on your zip code, your vehicle and your record. The point is not that your premium fell. It is that the market repriced, and a policy set during the 2023 spike has not been repriced unless you made it happen.
Why it got so expensive in the first place
The sequence matters, because it tells you whether the relief lasts. Used car values and repair costs spiked first in 2021 and 2022, insurance followed with a lag in 2023 and 2024, and insurance is now unwinding while used car prices have turned negative.
Cars got harder to fix. AAA tested three 2023 models and found that driver assistance systems “can add up to 37.6% to the total repair cost after a crash”. On a rear collision those components alone averaged $684 and made up 40.9% of the bill. A side mirror replacement was 70.8% of the repair cost at an average $1,067. A windshield replacement carried $360 of sensor transfer and calibration. CCC data shows 28.3% of repairable estimates now include calibrations.
More cars are being written off. Total loss frequency reached 23.1% of claims, an industry high, partly because the fleet is older. Nearly one claim in four now ends with the car being replaced rather than repaired.
Injury claims became the main cost. Bodily injury claim severity rose 10.3% in a year and 32% over four years. CCC data for 2025 shows bodily injury now accounts for 52.3% of combined dollars paid across injury and physical damage, up from 44.4% in 2022. Personal auto liability severity grew at a 7.1% compound annual rate from 2015 to 2024 against consumer price growth of 3.2%.
The thing to watch now: repair shop inflation is still running at 5.2% while the insurance index is at -5.1%. Insurers are currently pricing into improving loss ratios. If repair costs keep climbing, that gap closes.
How to lower car insurance: the levers, ranked
1. Shop the whole market on identical coverage
Nothing else is close. The Maryland Insurance Administration publishes a rate comparison guide that prices the same coverage for the same driver profile across insurers. For one of its 2026 scenarios, annual premiums ranged from $1,854 to $20,411 for identical coverage and an identical driver. That is an extreme profile, a nineteen year old male, so the spread is at the wide end. It is still a state regulator demonstrating that the same risk is priced wildly differently across the market.
New York’s regulator puts it plainly: “Consumers who shop get better value for their insurance dollar than those who do not.” The Insurance Information Institute suggests at least three quotes. Many state insurance departments publish their own comparison guides, and Texas runs HelpInsure.com, which also shows which insurers use credit scores.
Two things that make shopping work properly. Compare identical limits, deductibles and coverages, or you are comparing nothing. And do not worry about your credit: the CFPB lists insurance company credit checks among the soft inquiries that do not affect your score.
2. Raise your deductible
The Insurance Information Institute’s published ladder: “Increasing your deductible from $200 to $500 could reduce your collision and comprehensive coverage cost by 15 to 30 percent. Going to a $1,000 deductible can save you 40 percent or more.”
Note that its rungs are $200, $500 and $1,000. I could not find a sourced figure for the $500 to $1,000 step specifically from any regulator or industry body, and the numbers circulating for it online come from comparison sites with a commercial interest. So here is the arithmetic instead, which you can run against your own quote.
Raising your deductible by $500 costs you an extra $500 only when you claim. Using 2024 industry claim frequencies:
- Collision: 4.16 claims per 100 car years, so 0.0416 × $500 = $20.80 a year of expected extra cost.
- Comprehensive: 3.95 per 100, so 0.0395 × $500 = $19.75 a year.
- Both together: about $41 a year.
So if raising both deductibles from $500 to $1,000 cuts your premium by more than roughly $41 a year, it is expected-value positive. In practice the saving is far larger than $41, which is why this lever almost always wins. That calculation is mine, built on published claim frequencies.
The honest caveat: expected value is not affordability. The extra $500 is due all at once, at a bad moment. Do not raise a deductible to a number you could not produce tomorrow. New York requires insurers to give you information on how much you would save by adjusting deductibles, so ask for the real figure rather than guessing.
3. Drop collision and comprehensive on an old car
The canonical rule comes from the Insurance Information Institute: “If your car is worth less than 10 times the premium, purchasing the coverage may not be cost effective.”
Worked through: a car worth $3,000, with collision and comprehensive costing $450 a year on a $1,000 deductible. Ten times $450 is $4,500, and the car is worth less than that, so the coverage fails the test.
The harder version makes it starker. The insurer pays actual cash value minus the deductible, so $3,000 minus $1,000 is $2,000, the most you can ever collect, and only in a total loss. At $450 a year you pay the entire maximum possible payout in 4.4 years. That second calculation is mine.
This only applies to cars you own outright. A lender or lessor requires these coverages contractually.
4. Bundle, and take the discounts that apply to the big coverages
| Discount | Documented saving | Source type |
|---|---|---|
| Home and auto bundle | “Up to 15%” | State regulator |
| Telematics | Up to 30% to 40% claimed | Insurer disclosure |
| Good student | “Typically 10% to 20%” | State regulator |
| Multi-car | About 12% average | Insurer disclosure |
| Defensive driving course | 10% a year for three years, mandated in New York | State DMV |
| Non-smoker | 5% to 10% | State regulator |
| Passive restraints | “Up to 40% on medical payments coverage” | State regulator |
Read the last row carefully, because it is the trap. Forty percent off medical payments coverage is forty percent off one of the smallest lines on your policy. It sounds enormous and moves the total almost not at all. The same applies to good student discounts, which apply to the youthful driver portion. A discount is only worth what the coverage it applies to costs.
For paid-in-full, paperless, autopay, low mileage and affiliation discounts, no non-commercial source publishes a percentage. They exist and they are usually small. The Texas Department of Insurance makes the underlying point: “no state law or rule mandates discounts”. Every percentage above is voluntary, insurer-specific and state-specific.
Telematics, honestly
The one question to ask before enrolling: can this programme raise my premium, or only lower it? The answer differs by insurer and by state, and it is in the terms.
| Programme | Claimed saving | Can it raise your rate? |
|---|---|---|
| Nationwide SmartRide | Up to 40% | No. “This is a discount program … not raise your rates.” |
| State Farm Drive Safe & Save | Up to 30%, plus 10% for enrolling | Indirectly, if you exceed a low-mileage assumption |
| Progressive Snapshot | $328 a year on average, for those who save | Yes, in most states |
Note the wording on the Progressive figure. It is the average saving among “drivers who save with Snapshot”, which tells you nothing about how many do not. No insurer or regulator publishes what share of participants get surcharged, and any figure you see for that is not sourced.
On data: Progressive’s own FAQ says Snapshot collects time of day, hard braking and rapid acceleration, mileage and, in some states via the app, phone use while driving. Then this sentence, which deserves attention: “location data is collected as well, it doesn’t impact the Snapshot results you earn, but may be used for underwriting purposes.”
There is also a second, involuntary version of this to know about. US senators found that General Motors shared driving data from roughly 8 million vehicles with data brokers, that Hyundai shared data from 1.7 million vehicles for about 61 cents each, and that Honda shared data from 97,000 vehicles for a total of $25,920, which works out at 26 cents per car. GM ended those partnerships in March 2024, Verisk exited the business, and in January 2026 the FTC finalised an order banning GM for five years from disclosing geolocation and driver behaviour data to consumer reporting agencies. A Texas lawsuit over the same conduct appears still to be pending.
You can check what is held on you. LexisNexis runs C.L.U.E., which holds up to seven years of auto and property claims, and you are entitled to one free report every 12 months, provided within 15 days, via consumer.risk.lexisnexis.com or 866-897-8126. Verisk’s consumer reports are at fcra.verisk.com, with a consumer inquiry line on 1-800-709-8842. Both are worth reading before you shop, because an error in a claims history is an error you will pay for at every insurer.
The limits question, which is not about saving money
Cutting liability limits to the state minimum lowers your premium. It is also the one change on this page that can produce a catastrophe, and the arithmetic has moved against it.
Average bodily injury claim severity was $28,278 in 2024, and 2025 data puts the average payout above $30,000. California and Texas both set a minimum of 30/60, meaning $30,000 per person. The legal minimum is now roughly equal to, or below, the average injury claim. An average is not a worst case, and half the dollars sit in claims larger than it.
Florida is sharper still. Its requirement is $10,000 of personal injury protection and $10,000 of property damage liability, with no bodily injury liability required at all for ordinary drivers. A Florida driver at the legal minimum carries zero cover for injuries they cause.
Property damage minimums have the same problem. The average property damage claim was $6,770, which $10,000 covers, but total losses are now 23.1% of claims and a late model car is a multiple of that.
Those are facts and arithmetic. What limits to carry is your decision and depends on what you have to lose.
Credit, and the states where it does not count
In most states, a credit-based insurance score affects your premium. The only federal empirical study is the FTC’s 2007 report to Congress, which found 59% of consumers would see a decrease and 41% an increase, with a median increase of 16% and a median decrease of 13%. That study is nearly twenty years old and there is nothing comparable since, so treat the percentages as historical.
Where it is restricted, per the current NAIC model law chart:
- Massachusetts: full ban for private passenger auto. “Rates shall not be based, in whole or in part, on credit information.”
- Hawaii: banned for auto.
- California: effectively banned. Proposition 103 regulations set an exhaustive list of permitted rating factors, led by driving record, annual mileage and years of driving experience. Credit is not on it.
- Michigan: partial only. Credit cannot be used to deny, cancel or refuse renewal, but may be used in pricing with disclosure. “Michigan bans it” is a common overstatement.
- Maryland: partial, and the split surprises people. Banned as an underwriting consideration for homeowners; for auto, permitted only to rate new policies.
If a life event damaged your credit, the NAIC’s consumer guide advises asking your insurer for a “life event exception”. Most people do not know it exists.
How to lower car insurance: what to do this month
- Find your declarations page and write down every limit, deductible and coverage. This is what you will hold constant while you shop.
- Pull your C.L.U.E. report and check the claims history is right before anyone else prices you on it.
- Get at least three quotes on identical coverage, including one from a regional or mutual insurer, not only the national advertisers. Check your state insurance department for a comparison guide first.
- Ask your current insurer to match before you move. Retention pricing is real and the call is free.
- Price the $1,000 deductible explicitly. If it saves more than about $41 a year across both physical damage coverages, it is expected-value positive.
- Run the 10x test on any car over about eight years old.
- Ask whether the telematics programme can surcharge you, and decide about the location data separately from the discount.
- Leave your liability limits alone unless you have understood what the minimums do and do not cover.
The one line to remember: in a falling market, loyalty is expensive. The insurer who priced you in 2023 is not going to re-underwrite you out of kindness.
While you are auditing recurring costs, the same logic applies to everything else on autopay, and the method for finding and killing the ones you forgot is in the subscription cancellation guide. If your renewal season overlaps with employer benefits, the higher-value items are in the open enrollment checklist, and the medical payments coverage on your auto policy interacts with your health plan’s deductible and out-of-pocket maximum in ways worth understanding before you need it.
Figures current as of 17 September 2026. CPI data is from the BLS release of 11 September 2026. Claim severity and frequency are 2024 ISO and Verisk data via the Insurance Information Institute. State average premium figures are 2023 NAIC data, the most recent available. This is general information, not insurance advice.
Sources
- BLS, Consumer Price Index summary, August 2026
- BLS, CPI Table 1, August 2026
- BLS, CPI release for December 2025
- BLS, CPI release for December 2023
- AM Best, approved private passenger auto rate changes
- Triple-I and Milliman, 2025 personal auto combined ratio
- Insurance Information Institute, auto insurance facts and statistics including claim severity and frequency
- Insurance Information Institute, nine ways to lower your auto insurance costs
- AAA, The Cost of ADAS Repair fact sheet
- CCC Intelligent Solutions, Crash Course 2026
- CAS and Triple-I, Increasing Inflation on Liability Insurance
- Maryland Insurance Administration, Auto Rate Guide
- New York Department of Financial Services, how to shop for auto insurance
- Wisconsin Office of the Commissioner of Insurance, Consumer’s Guide to Auto Insurance
- NAIC, Consumer’s Guide to Auto Insurance
- NAIC, model law chart on the use of credit reports and scoring in underwriting
- Texas Department of Insurance, on auto insurance discounts
- Texas Department of Insurance, Auto Insurance Guide and state minimums
- Florida Highway Safety and Motor Vehicles, insurance requirements
- California DMV, insurance requirements
- 10 CCR 2632.5, California’s permitted auto rating factors
- FTC, report on the effects of credit-based insurance scores
- CFPB, what is a credit inquiry
- Progressive, Snapshot FAQ including data collected and location data
- Nationwide, SmartRide
- State Farm, Drive Safe & Save
- Senators Wyden and Markey, letter to the FTC on automaker driving data
- FTC, final order against GM and OnStar, January 2026
- CFPB, C.L.U.E. consumer report request details
- Florida Office of Insurance Regulation, 2026 auto rate decreases
- Insurance Journal, State Farm’s California auto rate decrease filing