
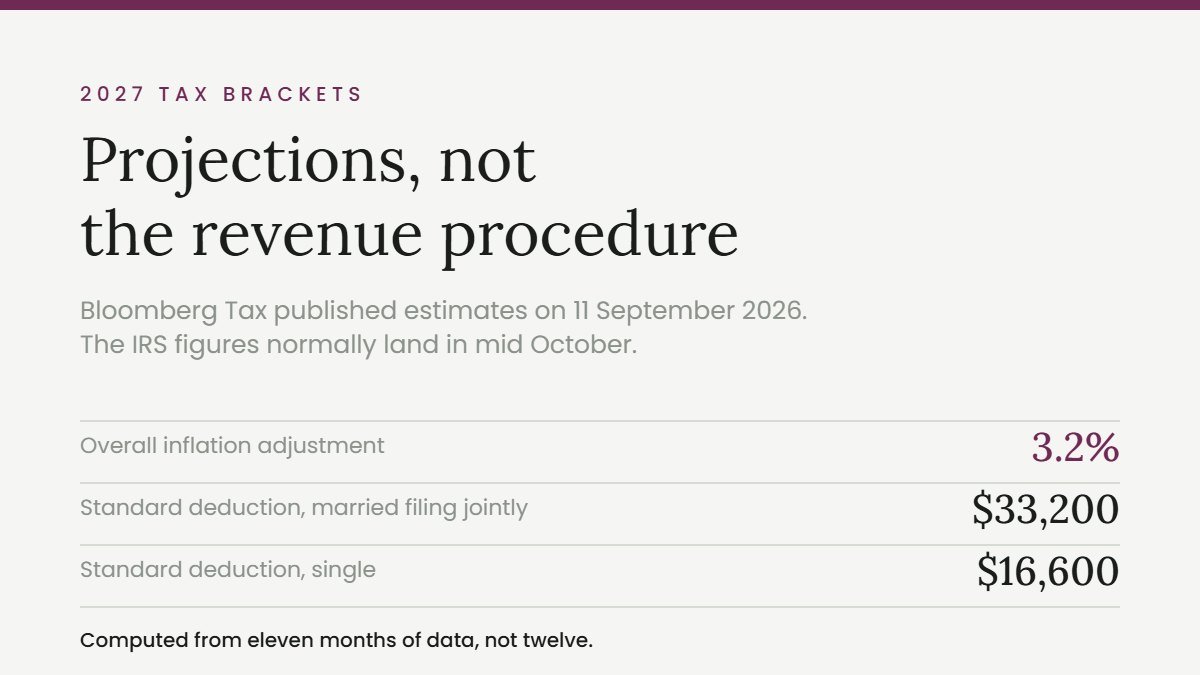
The 2027 tax brackets circulating right now are projections, not official figures, and this year they rest on an inflation index with a hole in it. The IRS has not published its revenue procedure. Bloomberg Tax published estimates on 11 September 2026, and every number you have seen since traces back to them.
The projections are useful. They are also, in at least one widely copied table, being reported next to the wrong comparison year. Here is the full set of projected 2027 tax brackets, what the method actually was, and where to be careful.
Key takeaways
- The projected overall adjustment is 3.2%, up from 2.7% the year before.
- The IRS figures are not out. They normally land between mid October and early November. Last year’s arrived on 9 October.
- The October 2025 CPI was never published because of the government shutdown, so the 2027 projections were computed from 11 months of data instead of 12.
- Projected standard deduction: $33,200 married filing jointly, $16,600 single, $24,925 head of household.
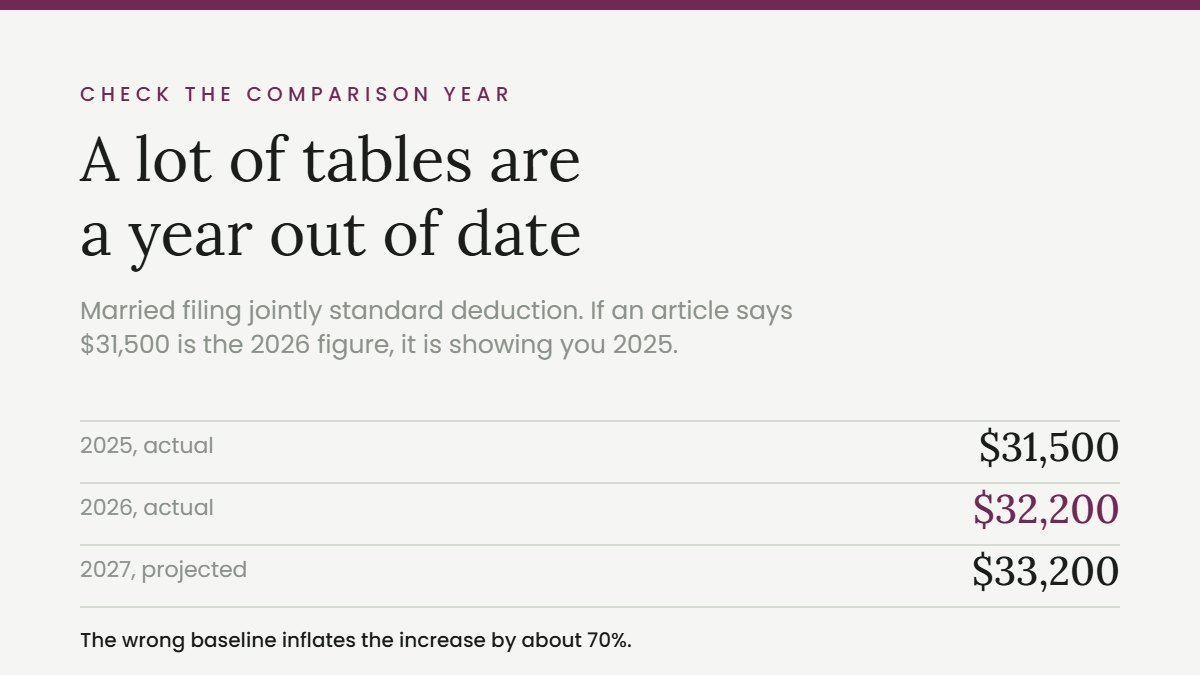
- Watch the comparison column. Several write-ups place the 2027 standard deduction next to the 2025 figures while labelling them 2026, which overstates the increase.
- Nothing new starts or expires in 2027. The story is pure indexing, plus a clock ticking toward the end of 2028.
Projected 2027 tax brackets, married filing jointly
| Rate | 2026, official | 2027, projected |
|---|---|---|
| 10% | $0 to $24,800 | $0 to $25,600 |
| 12% | $24,800 to $100,800 | $25,600 to $104,050 |
| 22% | $100,800 to $211,400 | $104,050 to $218,250 |
| 24% | $211,400 to $403,550 | $218,250 to $416,650 |
| 32% | $403,550 to $512,450 | $416,650 to $529,100 |
| 35% | $512,450 to $768,700 | $529,100 to $793,650 |
| 37% | over $768,700 | over $793,650 |
Projected 2027 tax brackets, single filers
| Rate | 2026, official | 2027, projected |
|---|---|---|
| 10% | $0 to $12,400 | $0 to $12,800 |
| 12% | $12,400 to $50,400 | $12,800 to $52,025 |
| 22% | $50,400 to $105,700 | $52,025 to $109,125 |
| 24% | $105,700 to $201,775 | $109,125 to $208,325 |
| 32% | $201,775 to $256,225 | $208,325 to $264,550 |
| 35% | $256,225 to $640,600 | $264,550 to $661,375 |
| 37% | over $640,600 | over $661,375 |
The seven rates themselves are not in question. They were made permanent by the 2025 tax law, so the only thing moving in the 2027 tax brackets is where each one starts.
Standard deduction, and the comparison error
| Filing status | 2026, official IRS | 2027, projected |
|---|---|---|
| Married filing jointly | $32,200 | $33,200 |
| Head of household | $24,150 | $24,925 |
| Single and married filing separately | $16,100 | $16,600 |
Here is the thing to be careful about. Several articles running the 2027 projection place it beside $31,500, $23,625 and $15,750 and label that column 2026. Those are the 2025 amounts, the ones the 2025 tax law set. The official 2026 figures are $32,200, $24,150 and $16,100, published by the IRS last October.
Using the wrong baseline turns a projected increase of about $1,000 for a married couple into a projected increase of $1,700. The projections themselves are internally consistent, since $32,200 multiplied by 1.031 lands at roughly $33,200. It is only the comparison column that is wrong, and if you are estimating next year’s withholding off the difference, it matters.
Alternative minimum tax exemption
| Status | 2026 | 2027, projected |
|---|---|---|
| Married filing jointly | $140,200 | $144,700 |
| Unmarried | $90,100 | $93,000 |
| Married filing separately | $70,100 | $72,350 |
| Estates and trusts | $31,400 | $32,500 |
Bloomberg did not publish projected capital gains thresholds, estate exclusion or gift exclusion. Figures for those are circulating, but they are independent bloggers’ own calculations rather than Bloomberg’s, and they are usually presented without that distinction. Treat them accordingly.
A reminder about how brackets work
Worth restating, because the single most common mistake about tax brackets is not which numbers they are, but how they apply. Moving into a higher bracket does not re-tax the money below it. Only the dollars inside each band are taxed at that band’s rate.
Take a married couple with $130,000 of taxable income in 2027 under the projections above. They are “in the 22% bracket”, and the tax works out like this:
| Band | Income taxed here | Tax |
|---|---|---|
| 10% on the first $25,600 | $25,600 | $2,560 |
| 12% from $25,600 to $104,050 | $78,450 | $9,414 |
| 22% from $104,050 to $130,000 | $25,950 | $5,709 |
| Total | $130,000 | $17,683 |
That is an effective rate of about 13.6%, not 22%. The marginal rate, 22%, is what applies to the next dollar earned. It is the right number for deciding whether to take a bonus this year or next, and the wrong number for estimating your total bill.
Note also that this starts from taxable income, which is after the standard deduction. A couple taking the projected $33,200 standard deduction needs roughly $163,200 of gross income to reach $130,000 taxable.
What the 3.2% adjustment is worth
Indexing exists to stop inflation quietly raising your tax rate, and it works, but it is not a tax cut. If your income rises by exactly the same 3.2%, the 2027 tax brackets leave your effective rate unchanged. You are no better off; you have simply not been made worse off.
The people who genuinely gain are those whose income is flat or rising more slowly than 3.2%, because for them the bands move up while their income does not. Retirees living on a fixed drawdown are the clearest case.
Why the 2027 tax brackets are shakier than usual this year
Inflation adjustment is not a judgement call. It is a formula in the tax code, and the formula names a specific index and a specific window.
The index is the Chained Consumer Price Index for All Urban Consumers, the C-CPI-U, named in section 1(f)(6) of the tax code. The measurement window is the twelve months ending 31 August. For tax year 2027 that means September 2025 through August 2026.
October 2025 is missing from that window. The Bureau of Labor Statistics never published it, because of the lapse in federal appropriations during the shutdown. The month does not exist in the data series and it is not being backfilled.
So the 2027 tax brackets above were computed on an eleven month average standing in for a twelve month one. That is a reasonable patch. It is also not the calculation the statute describes, and the IRS may handle the gap differently, or round differently, or adopt a different base year average. In a normal year, projections land within a dollar or two of the official figures. This year that confidence is not earned.
If you want one sentence for why to wait: the projections are the best available estimate, and they are an estimate of a number that was computed from incomplete inputs.
The same revenue procedure sets the health FSA limit, which is why the 2027 FSA and HSA figures are currently half published and half not.
What is actually legislated for 2027
Almost nothing, and that is the useful finding. The 2027 tax brackets are moving; the rules around them are not.
| Provision | Status in 2027 |
|---|---|
| Seven rate brackets | Permanent |
| Tips, overtime, senior and auto loan deductions | In force, expire after 2028 |
| SALT cap increase | In force through 2029 |
| Itemised deduction limitation | Permanent |
| Dependent care FSA at $7,500 | In force from 2026 |
| Full expensing for structures | Expires after 31 December 2028 |
No major provision begins, expires or phases out specifically in 2027. The year is pure inflation indexing. 2028 is where the cliff is, and the deductions for tips, overtime, seniors and car loan interest are the ones that go over it. If any of those are material to your household, 2027 is the last full year to plan around them, not to be surprised by them.
Two other 2027 numbers run on the same clock. The Social Security COLA is announced in October off a different index, and if you pay quarterly, your estimated tax payments safe harbor is set by last year’s return rather than by these brackets.
What to do with projected 2027 tax brackets
- Use them for direction, not for arithmetic. Knowing the brackets move up about 3.2% is enough to decide whether a bonus lands in a higher band. It is not enough to set a withholding figure to the dollar.
- Do not adjust your W-4 off projected 2027 tax brackets. Wait for the revenue procedure in October or November. The cost of waiting six weeks is nothing.
- Check the comparison year on any table you read. If the married filing jointly standard deduction column says $31,500 for 2026, the article is a year off.
- If you are deciding between December 2026 and January 2027 for income you can time, the 3.2% shift is real and it is in your favour to defer into the wider brackets, all else equal.
- Diarise mid October. That is when the projections become facts.
Current as of 13 September 2026. This article will be updated with the official 2027 tax brackets when the IRS publishes its revenue procedure.
Sources
- Accounting Today on the Bloomberg Tax 2027 projections
- CPA Practice Advisor, Bloomberg Tax projects 2027 tax rates
- IRS, tax inflation adjustments for tax year 2026
- IRS Revenue Procedure 2025-32
- 26 U.S.C. 1(f), inflation adjustment and the C-CPI-U
- IRS, inflation adjusted tax items by tax year
- Tax Foundation, One Big Beautiful Bill Act tax changes